With QFM’s Lead-Time Compression Model & Demurrage Analytics, Importers Save Time and Cost—Without Sacrificing Global Reliability
Executive Summary:
In today’s capacity-tight, surcharge-heavy ocean market, speed and reliability don’t have to be opposites. QFM Shipping’s Lead-Time Compression (LTC) model and Demurrage & Detention (D&D) analytics systematically remove days from your door-to-door cycle while reducing avoidable port/storage costs—without eroding service quality. The result: faster cash conversion, lower landed cost, and steadier inventory flow across lanes like Karachi ⇄ Jebel Ali, Karachi ⇄ Antwerp/Hamburg, Karachi ⇄ Singapore, Karachi ⇄ Shanghai, and beyond.
Why Traditional “Fast vs. Cheap” is a False Choice
Most importers assume shaving days off transit means paying premiums or accepting higher risk. In practice, latent inefficiencies—fragmented hand-offs, unmanaged port dwell, late document readiness, underused LCL consolidations, and poor milestone discipline—are what quietly add 5–12 days and 2–5% to landed cost.
QFM’s approach doesn’t just pick a quicker sailing. We re-engineer the end-to-end:
-
Compress the critical path (where a single delay stalls the whole shipment).
-
Stabilize the non-critical steps (so variance is absorbed before it becomes dwell).
-
Apply predictive D&D analytics (so containers move before the meter runs).
The QFM Lead-Time Compression (LTC) Model: How It Works
-
Map the Baseline
-
Break the lane into atomic milestones: PO release → factory gate → export CFS/CY → load → main leg → discharge → ICD/yard → customs → final delivery.
-
Capture lead/lag times and variability (median, p90) per step.
-
-
Pinpoint the Critical Path
-
Identify where a delay blocks downstream moves (e.g., late Form-E, HS code queries, or missing ARR/DO).
-
Distinguish structural delays (e.g., weekly feeder windows) from behavioral (e.g., internal approval batching).
-
-
Targeted Compression Levers
-
Pre-CFS documentation lock (shipper’s docs, BL instructions, certificates) 48–72h earlier.
-
LCL consolidation windows optimized to bi-weekly (or faster) cadence, avoiding missed cut-offs.
-
Parallelization: run customs pre-advice and cargo insurance confirmation in parallel with sailing confirmation.
-
Time-definite drayage: reserve port trucking slots matched to predicted discharge windows.
-
Smart lane selection: choose routings where voyage length and feeder alignment minimize weekend/holiday traps.
-
-
Milestone Control Tower
-
A live view of handover SLAs (CFS in-scan, CY gate-in, VGM cut-off, load list finalization) with alerts when variance > allowable buffer (e.g., >8 hours).
-
Exception playbooks: predefined actions by delay type (doc, port, carrier roll, weather).
-
-
Continuous Kaizen
-
Post-shipment variance analysis: which buffers were consumed? Why?
-
Update SOPs monthly; bake improvements back into the LTC blueprint.
-
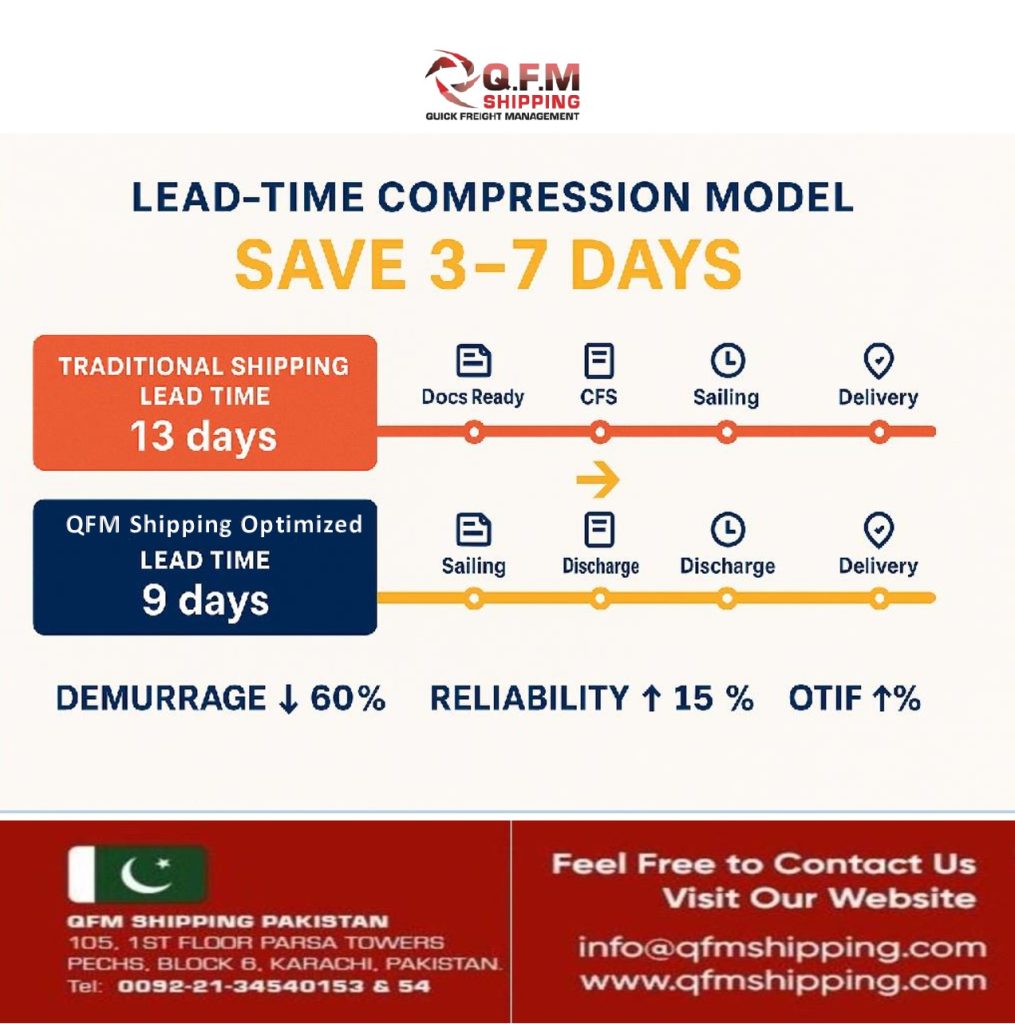
Typical impact: 3–7 days shaved from door-to-door without buying speed at any price—just by sequencing, parallelizing, and controlling the milestones better.
Demurrage & Detention (D&D) Analytics: Turn Hidden Fees into Predictable Outcomes
Demurrage (port/terminal storage) and detention (late container return) erode margins and create planning chaos. QFM’s D&D analytics address this on three fronts:
-
Prediction
-
ETA-to-available forecast (ETA → discharge → customs exam risk → yard release) at container level.
-
Free-day consumption countdown that blends carrier tariff, terminal behavior, and your own clearance speed.
-
-
Prevention
-
Doc readiness gating: no sailing confirmation unless import docs meet a “green” completeness score.
-
Broker orchestration: customs broker receives digital pre-advice before vessel arrival.
-
Slot booking & yard prioritization: drayage aligned with predicted release hour, not “sometime tomorrow.”
-
-
Negotiation & Recovery
-
Data-backed tariff discussions with carriers/terminals when systemic yard issues inflate dwell.
-
Root-cause playbooks (exam, mismatch, hold) to speed resolution and minimize paid days.
-
Typical impact: 30–60% reduction in D&D exposure on stabilized lanes after 1–2 cycles of analytics-led improvements.
Example: Karachi → Jebel Ali → Karachi (Imports)
Baseline (typical mid-market importer):
-
Door-to-door: 11–13 days
-
Average D&D per container: USD 250–400
-
Late doc rate: 22% of shipments
After QFM LTC + D&D analytics (two cycles):
-
Door-to-door: 8–9 days (−3 to −4 days)
-
D&D: ≤ USD 100 on average (−60%+)
-
Late doc rate: <5%
-
Reliability ↑: p90 variance narrows by 2–3 days, improving stock availability and forecast accuracy.
Where the Savings Come From (Simple Model)
Let:
-
C = daily cost of capital tied in inventory per shipment (USD/day)
-
D = days reduced via LTC
-
E = average D&D avoided (USD/shipment)
-
S = net savings
S ≈ (C × D) + E − (process change cost)
For a typical consignment where C = USD 120/day, D = 4 days, E = USD 200, and one-off process uplift costs amortize to USD 50/shipment:
S ≈ (120 × 4) + 200 − 50 = USD 630/shipment.
Scale that across 30 import shipments/month → ~USD 18,900/month (~USD 226,800/year) in real, compounding savings—while reliability improves.
Reliability by Design (Not Hope)
Speed alone is fragile. QFM embeds reliability guardrails:
-
Variance caps per milestone (e.g., doc handover ≤ 12h; CFS dwell ≤ 24h after gate-in).
-
Cut-off adherence with backup consolidations (bi-weekly/weekly) to avoid rollovers.
-
Carrier & terminal scorecards on rollover frequency, yard congestion, lift performance.
-
S&OP sync with your planning team so safety stock and inbound cadence align with the new, compressed lead times.
Outcome: Better On-Time In-Full (OTIF), fewer backorders, smoother e-commerce replenishment, and higher supplier confidence.
What Makes QFM Different
-
LCL Mastery with Direct Routings: Purpose-built for SME/ mid-market importers who need predictability without FAK-level rate shocks.
-
Origin–Destination Ownership: Karachi & Jebel Ali offices plus partner hubs in Antwerp, Hamburg, Singapore, Shanghai, New York give us local levers on both ends.
-
Control-Tower Culture: We treat every lane as a living system. Data feeds SOPs; SOPs feed better data.
-
Transparent Playbooks: You see exactly which levers created savings and how we’ll sustain them.
Compliance & Risk Management (Quietly Built-In)
-
Customs readiness checks lock before sailing.
-
HS classification verification reduces exam risk.
-
Carrier/Terminal contingency plans for weather or labor events.
-
Data governance: shipment data and docs handled with audit-ready discipline.
Quick Start: 30-Day Action Plan
Week 1: Diagnostic
-
Pull last 8–12 shipments on a target lane; baseline times & D&D.
-
Identify three biggest dwell drivers (e.g., doc lag, missed CFS, weekend trap).
Week 2: SOP Uplift
-
Implement pre-CFS doc lock, broker pre-advice, drayage slot policy.
-
Calibrate consolidation cut-offs to demand rhythm.
Week 3: Control Tower
-
Go live with milestone alerts; set variance caps; publish scorecards.
Week 4: Review & Scale
-
Measure days saved and D&D avoided.
-
Extend to adjacent lanes (e.g., Hamburg → Karachi, Singapore → Karachi).
Case Snapshot: Apparel Importer (EU → KHI)
-
Problem: Frequent weekend discharges causing 2–3 days of idle yard time and demurrage.
-
QFM Shipping Fix: Shifted sailing window by 48h to hit Wed/Thu discharge; introduced doc-ready gating and drayage pre-booking.
-
Results (first 6 weeks):
-
Lead time from 28–30 → 25–26 days (−3 to −4 days)
-
D&D per FEU from USD 320 → USD 80
-
OTIF improved from 84% → 95%
-
KPIs We Track (and You See)
-
Door-to-door days (median, p90)
-
Milestone dwell per leg (CFS, CY, yard)
-
D&D $/container and free-day utilization
-
Cut-off adherence % and rollover rate
-
Docs-ready on time %
-
OTIF and variance to plan
Call to Action
If your shipments are arriving “roughly on time” but costing too much, or cheap but constantly late, it’s time to re-write the trade-off. With QFM’s lead-time compression model and demurrage analytics, you get both: time and cost savings with global service reliability.
Let’s baseline a lane together. Share 8–12 recent shipments; we’ll return a quantified compression & D&D avoidance plan you can start using this month.
At QFM Shipping, our commitment is not just to move cargo — it’s to move your business forward with dependable global connectivity.
Book Your Space Today
Contact Us:
Email: info@qfmshipping.com
Website: www.qfmshipping.com
Tags:
lead time compression, demurrage analytics, detention, LCL consolidation, Karachi Jebel Ali shipping, import cost reduction, control tower logistics, OTIF, QFM Shipping,